 The Health Department today released the latest New York City Community Air Survey (NYCCAS) report, which shows continuing improvements in air quality citywide.
The report summarizes twelve years of data for the largest ongoing urban air monitoring program of any U.S. city.
It describes seasonal trends in air pollution levels from winter 2008-2009 through fall 2020 and highlights sources that contribute to high levels of pollutants in New York City neighborhoods.
Maps displaying neighborhood air pollution levels by year are also available online.
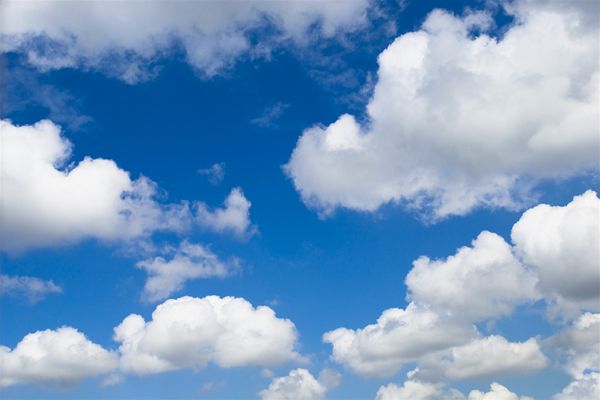
“The health of our planet is a critical public health issue for New Yorkers,” said Health Commissioner Dr. Ashwin Vasan. “The choices we make as a global community to combat or perpetuate climate change, show up in our city every day, with deeply unequal impacts. And as a city, we can develop models for the nation to ensure we are breathing cleaner air and launching policies to reduce greenhouse gas emissions, in the effort to slow the warming of our planet. We can all breathe easier when cities commit to fighting climate change and to environmental protection. It saves lives, now and into the future.”
NYC Community Air Survey Findings before, during and after NY PAUSE
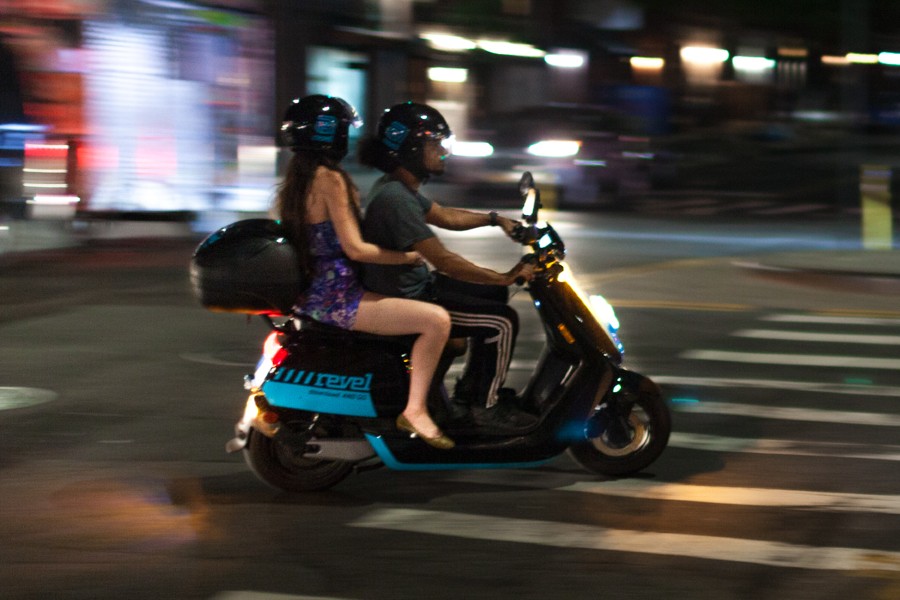
- During NY Pause, there was less traffic at bridges and tunnels, shorter travel times on major roadways, and fewer open small businesses, especially in leisure and hospitality.
- Reductions in activity during NY Pause resulted in a 29% decline in NO2 and a 25% decline in PM2.5 from levels during spring 2019.
- Air pollution decreases occurred mostly in Manhattan’s central business district, south of 60th Street. Reductions were smaller in neighborhoods that have the highest rates of air pollution-related Asthma Emergency Department visits.
NYC Community Air Survey Findings Between 2009 and 2020
- Annual average levels of fine particulate matter (PM 2.5), nitrogen dioxide and nitric oxide have declined 43%, 39% and 56%, respectively.
- Summertime average ozone levels have remained stable.
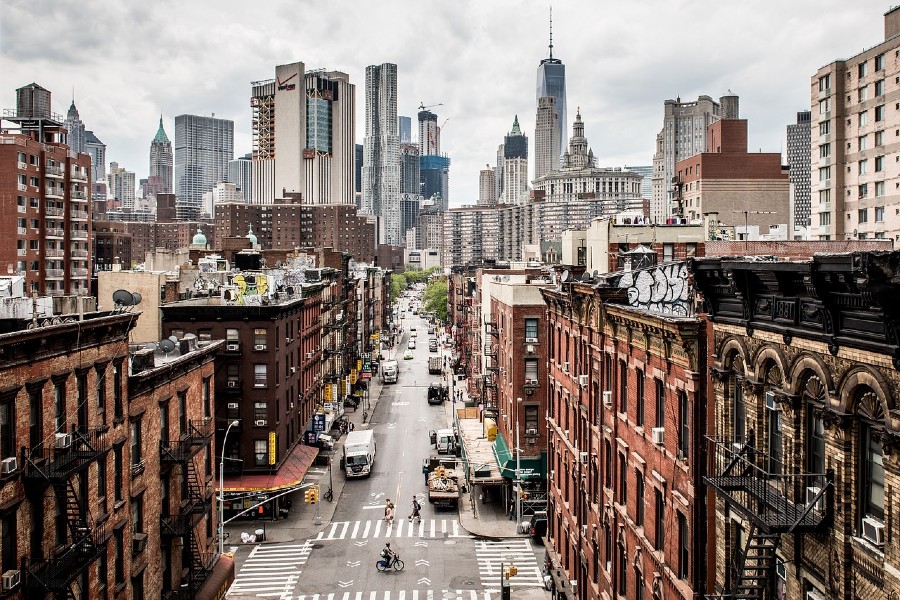
- High levels of fine particulate matter, nitrogen dioxide, and nitric oxide – pollutants that exacerbate heart and respiratory disease – continue to be observed in areas of high traffic density, building density, and industrial areas.
- PM2.5 emissions from buildings have continued to decline, reflecting the impact of city regulation of heating oil. Meanwhile, emissions from commercial cooking – grills and charbroilers in restaurants – now best explain the differences in fine particulate concentrations among neighborhoods. Recent City Air Code updates have created a framework to collaboratively start addressing this emissions source.
More data on local air quality and other health issues related to the environment can be found at the New York City Environment and Health Data Portal.
Annual Average Particle Matter in NYC, 2009:

Annual Average Particle Matter in NYC, 2020:

The New York City Community Air Survey
The Health Department conducts NYCCAS with Queens College of the City University of New York to evaluate how air quality differs across New York City.
Air pollution measurements are taken each season with monitors mounted at street level at about 100 locations throughout the five boroughs.
More information on NYCCAS can be found here.
The Health Department prioritizes the reduction of emissions and air quality improvement citywide.
Become a Harlem Insider!
By submitting this form, you are consenting to receive marketing emails from: Harlem World Magazine, 2521 1/2 west 42nd street, Los Angeles, CA, 90008, https://www.harlemworldmagazine.com. You can revoke your consent to receive emails at any time by using the SafeUnsubscribe® link, found at the bottom of every email. Emails are serviced by Constant Contact