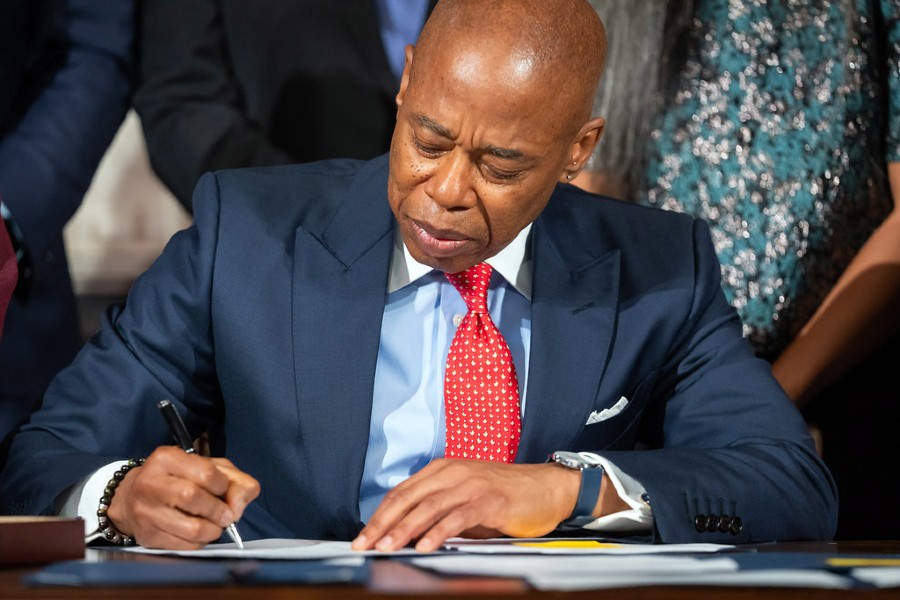
New York City Mayor Eric Adams today released the Mayor’s Management Report (MMR) for Fiscal Year 2022 (FY22), a report assessing city agency performance between Fiscal Year 2022 (FY22), from July 1, 2021 to June 30, 2022.
The report — which contains nearly 2,000 indicators covering 45 city agencies — is the first published under the Adams administration. The FY22 MMR reflects a unique period that spans two mayoral administrations amid broader societal challenges, including the COVID-19 pandemic, that impact service delivery across various sectors of civic life.
“The Mayor’s Management Report is a critical tool for public accountability on how agencies are serving people across the city,” said Mayor Adams. “Despite two years of pandemic disruptions and ongoing national economic challenges, this year’s report highlights many areas of success early in our administration, including emergency preparedness, street safety, use of public spaces, quality of life, and youth engagement. As we continue the reopening process, we will remain laser-focused on improving agency performance across city government, breaking down silos, and ‘Getting Stuff Done’ for all New Yorkers.”
“The Mayor’s Management Report is a triumph of public accountability and a pioneering example of data-driven performance management that remains a national model,” said Mayor’s Office of Operations Director Daniel Steinberg. “Mayor Adams ran on a platform of leveraging technology and data to improve performance across government. That’s why we are proud to deliver on his vision with the first MMR published in a digital format, a new mapping function, and new indicators relating to customer service, customer experience, and civic engagement. At this critical juncture for our city, having good data to inform decision-making is more important than ever.”
Available in a new, user-friendly digital format debuted earlier this year, this year’s MMR provides granular insight into agency performance indicators, and offers a new mapping function that allows users to view certain data by neighborhood. It also includes two dozen new metrics on customer service, customer experience, and civic engagement, underscoring the administration’s commitment to ensuring all agencies that interface with the public provide the best possible service to New Yorkers.
The MMR is required by Section 12 of the New York City Charter to be released twice a year to the City Council and the public reporting on agency performance. The Preliminary Mayor’s Management Report (PMMR) covers the first four months of the fiscal year, while the MMR covers the full fiscal year. It was first published in 1977 following the city’s fiscal crisis.
Highlights of the Fiscal Year 2022 MMR include:
Small Business Support
· The New York City Department of Small Business Services (SBS) served 41.2 percent more unique customers and businesses over the previous fiscal year.
· The dollar value of financial awards to businesses, number of awards going to businesses, and number of unique businesses that received financial awards facilitated or disbursed by SBS went up by $177,790,000, 9,318, and 9,203 respectively.
· The New York City Department of Consumer and Worker Protection reduced the average processing time for a license application by roughly two days — a 24.8 percent reduction over Fiscal Year (FY21).
Housing
· For the first time ever, the New York City Department of Housing Preservation and Development is tracking new metrics to measure how long the process takes for New Yorkers going through the Section 8 and housing lottery processes, helping the administration hold itself accountable to reducing administrative burdens and maintaining focus on customer service — as proposed in Mayor Adams’ “Housing Our Neighbors: A Blueprint for Housing and Homelessness.”
· The New York City Housing Authority (NYCHA) renovated a record number of units through the Permanent Affordability Coming Together (PACT) program, helping nearly 6,000 NYCHA households finally live in the high-quality, permanently-affordable housing they deserve.
Emergency Preparedness & Response
· Through its Ready New York campaign, New York City Emergency Management educates city residents on preparedness. In FY22, the agency held emergency management and preparedness education sessions for 50,854 participants, through presentations, educational fairs, and preparedness in the workplace presentations — a 644.2 percent increase compared to FY21.
· The Fire Department of the City of New York provided 484.1 percent more fire and life-safety education presentations and completed 152 percent more risk-based inspections performed by uniformed personnel compared to FY21.
· In FY22, counterterrorism training hours increased 67 percent for uniformed members of the New York City Police Department, and 694 percent for non-members.
· The New York City Department of Buildings improved its average time to respond to Priority A (emergency) complaints by more than 25 percent.
· The New York City Department of Environmental Protection (DEP) reduced its average time to repair or replace high-priority broken or inoperative hydrants and its average time to close asbestos complaints by 13 percent and 21.5 percent, respectively.
Street Safety
· The New York City Department of Transportation (DOT) installed 31.9 lane miles of protected bike lanes — the most miles ever installed in a single fiscal year.
· Fatalities for bicyclists/pedestrians and motorists/passengers dropped by 12 and 6 percent, respectively, compared to FY21.
· DOT increased installations of speed reducers by 152 percent and leading pedestrian intervals by 213 percent.
· The city added 70 percent more bike parking spaces than it did in FY21.
· The New York City Taxi and Limousine Commission nearly doubled the number of summonses issued over the previous fiscal year.
Use of Public Spaces
· All three library systems — the New York Public Library, Brooklyn Public Library, and Queens Public Library — saw increases in total library attendance by roughly 272 percent, 267 percent, and 152 percent, respectively.
· New York City Parks & Recreation (NYC Parks) saw attendance at recreation centers reach 776,001 during FY22, following extended closures to the public.
· Over 100,000 members were registered in NYC Parks’ new membership management system in less than 10 months.
· Attendance also increased at historic house museums by 11 percent, skating rinks by 63 percent, and other NYC Parks programming by 225 percent.
· Total trees planted increased by 47 percent. NYC Parks’ Capital Tree Planting Program planted its most street trees since Fiscal Year 2016, and planting in landscaped areas of parks and natural areas increased by 32 percent and 38 percent, respectively.
· For the first time since Fiscal Year 2014, in-service rates met or exceed targets for NYC Parks comfort stations, spray showers, and drinking fountains.
· NYC Parks pruned 43,463 street trees through its block pruning program — a 130 percent increase from last year.
· NYC Parks conducted 184,449 total tree inspections, the most of any fiscal year since this metric was introduced in Fiscal Year 2018.
Quality of Life
· The New York City Economic Development Corporation removed more than 9,400 sites — totaling 3.4 million square feet — of graffiti through its Graffiti Free NYC program in FY22, following the suspension of this program during the pandemic.
· The New York City Department of Sanitation cleaned 34 percent more vacant lots and 96 percent more non-lot locations.
Youth and Civic Engagement
- The New York City Department of Cultural Affairs served 144 percent more schools, non-profit organizations, and government agencies through its Materials for the Arts — New York City’s premier creative reuse center — than in FY21.
- The New York City Department of Youth and Community Development served 155 percent more youth through their street outreach.
Become a Harlem Insider!
By submitting this form, you are consenting to receive marketing emails from: Harlem World Magazine, 2521 1/2 west 42nd street, Los Angeles, CA, 90008, https://www.harlemworldmagazine.com. You can revoke your consent to receive emails at any time by using the SafeUnsubscribe® link, found at the bottom of every email. Emails are serviced by Constant Contact