This time, the Finex glossary back to discuss a technical indicator.
This indicator is one of the most popular, helping traders to determine potential good entry points to buy (when securities are oversold), as well as points to sell (sell points) – when securities are overbought.
The Relative Strength Index is still widely used today. Many traders also use it to watch for divergence signal against possible upcoming trend changes.
Understanding the Relative Strenght Index (RSI)
The Relative Strength Index (RSI) is a momentum oscillator that measures the speed and change of price movements. RSI was developed by J. Welles Wilder, a mechanical engineer who turned his profession into a technical analyst.
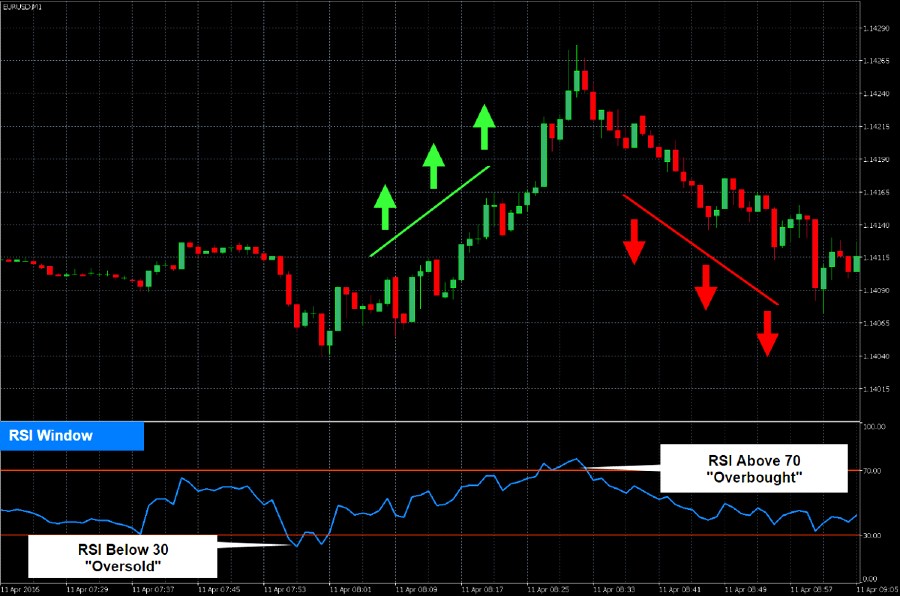
The RSI oscillates between 0 and 100 and is usually measured over a 14 day period. The RSI is considered overbought when above 70 and oversold when below 30. As long as the trend remains strong, the RSI may remain overbought or oversold for an extended period of time.
Profit from trading using the MetaTrader 4 platform.
The RSI often forms chart patterns that may not be visible on the underlying price chart, such as double tops and bottoms and trend lines. With RSI we can also see support/resistance levels.
In an uptrend or bull market, the RSI tends to stay in the range of 40 to 90 with the 40-50 zone as support. During a downtrend or bearish trend, the RSI tends to stay between the 10 to 60 range with the 50-60 zone as resistance. This range will vary depending on the RSI setting and how strongly the underlying security or market trend is performing.
If the underlying price chart displays a new high or low that the RSI doesn’t confirm, this divergence could signal a price reversal. If the RSI displays a lower high and then follows a downside movement below the previous low, it means that a Top Swing Failure has occurred. If the RSI displays a higher low, followed by an upward movement above the previous high, it means that a Bottom Swing Failure has occurred.
Trading with RSI
Quoted from Investopedia, here are the steps for trading using the RSI indicator for intraday traders with one additional indicator:
- Monitor the RSI for readings indicating an overbought or oversold market.
- Watch for momentum or other trend indicators to confirm signs of retracement (temporary price reversals amid an expanding trend). For example, if the RSI shows an oversold reading, it means that we should be prepared to anticipate an upward retracement, although at the same time this is not necessarily confirmed.
To profit from a retracement, make sure one of these conditions is met:
- The moving average convergence divergence (MACD) has shown a price divergence (for example, if the price has made a new low, but the MACD has not and has changed from a downslope to an upslope).
- Average directional index (ADX) has changed towards the potential retracement.
If the above conditions are met, then you should consider starting the trade with a stop loss just beyond the current low or high, and should also see if the transaction is a buy or a sell. The initial profit target can be determined from the nearest identified support/resistance level.
How to determine Stop Loss and Take Profit
How to Calculate RSI
A very technical and complicated explanation is needed to calculate the complete RSI. We need to read for ourselves the explanation from Wilder contained in his 1978 book entitled New Concepts in Technical Trading Systems.
However, there is a fairly simple formula:
RSI = 100 – [100 / (1 + (Average Price Change Up / Average Price Change Down)]
Need to Know More…
We already know that the Relative Strength Index is overbought when it is above 70 and oversold when it is below 30. However, the levels can be adjusted to better match the price movement of the security you want to observe. If, for example, the RSI of a security consistently reaches above 70 or below 30 without correctly forecasting changes in price trends, traders can adjust the upper end to 80 and/or the lower end to 20 for more reliable trading signals.
Traders should keep in mind that during periods of a very strong trend, the price of a security can continue to rise for a long time after oscillators such as the RSI have signaled a trade-off overbought side in the market. The same caveat applies to a prolonged downtrend price movement that may occur after the RSI indications regarding an oversold market.
Bullish and bearish markets play a big role in the behavior of the RSI. In a bull market, the RSI value is usually in the 40 to 90 range, with the 40-50 range seen as support. In bear markets, readings usually remain in the 10 to 60 range, with the 50-60 signaling resistance zone. This is a typical range, but can vary based on the setting, as well as the strength of the underlying trend of a particular security.
In addition to the basic 70/80 or 30/20 reading, traders should also pay attention to the difference between the price movement and the RSI value. When prices hit new lows or highs that are not supported by new lows or highs corresponding to the RSI reading, this can be indicated as a potential impending price reversal.
Become a Harlem Insider!
By submitting this form, you are consenting to receive marketing emails from: Harlem World Magazine, 2521 1/2 west 42nd street, Los Angeles, CA, 90008, https://www.harlemworldmagazine.com. You can revoke your consent to receive emails at any time by using the SafeUnsubscribe® link, found at the bottom of every email. Emails are serviced by Constant Contact