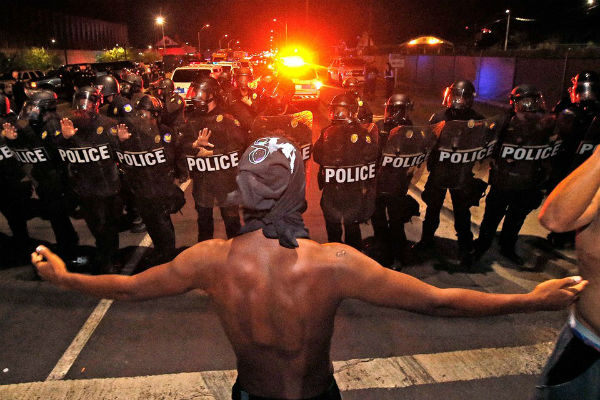
 In an alarming that reaches from Harlem to Hollywood is a story written by Kia Makarechi for Vanity Fair Magazine reports that as the nation reels from a series of high-profile fatal shootings of black men by police officers, many have decried the lack of readily available data on how racial bias factors into American policing. But while it’s true that there is no adequate federal database of fatal police shootings (F.B.I. director James Comey has described the lack of data as “embarrassing and ridiculous”), there exists a wealth of academic research, official and media investigations, and court rulings on the topic of race and law enforcement.
The Hive has collected 18 such findings below. This list is not exhaustive, and does not purport to comment on the work of all police officers. It is, rather, merely a digest of the information available at present. Sometimes, studies and investigations reveal evidence of intentional bias; other studies point to broader societal and institutional factors that lead to implicit bias. Taken together, the research paints a picture of a nation where a citizen’s race may well affect their experience with police—whether an encounter ends with a traffic stop, the use of police force, or a fatal shooting.
POLICE KILLINGS OF UNARMED AMERICANS
1. A study by a University of California, Davis professor found “evidence of a significant bias in the killing of unarmed black Americans relative to unarmed white Americans, in that the probability of being black, unarmed, and shot by police is about 3.49 times the probability of being white, unarmed, and shot by police on average.” Additionally, the analysis found that “there is no relationship between county-level racial bias in police shootings and crime rates (even race-specific crime rates), meaning that the racial bias observed in police shootings in this data set is not explainable as a response to local-level crime rates.”
2. An independent analysis of Washington Post data on police killings found that, “when factoring in threat level, black Americans who are fatally shot by police are, in fact, less likely to be posing an imminent lethal threat to the officers at the moment they are killed than white Americans fatally shot by police.” According to one of the report’s authors, “The only thing that was significant in predicting whether someone shot and killed by police was unarmed was whether or not they were black. . . . Crime variables did not matter in terms of predicting whether the person killed was unarmed.”
3. An analysis of the use of lethal force by police in 2015 found no correlation between the level of violent crime in an area and that area’s police killing rates. That finding, by the Black Lives Matter–affiliated group Mapping Police Violence, disputes the idea that police only kill people when operating under intense conditions in high-crime areas. Mapping Police Violence found that fewer than one in three black people killed by police in 2016 were suspected of a violent crime or armed.
HOW POLICE DETERMINE WHOM TO STOP
4. A report by retired federal and state judges tasked by the San Francisco district attorney’s office to examine police practices in San Francisco found “racial disparities regarding S.F.P.D. stops, searches, and arrests, particularly for Black people.” The judges, working with experts from five law schools, including Stanford Law School, found that “the disparity gap in arrests was found to have been increasing in San Francisco.” (Officers in San Francisco were previously revealed to have traded racist and homophobic text messages, and those working in the prison system had reportedly staged and placed bets on inmate fights.)
In San Francisco, “although Black people accounted for less than 15 percent of all stops in 2015, they accounted for over 42 percent of all non-consent searches following stops.” This proved unwarranted: “Of all people searched without consent, Black and Hispanic people had the lowest ‘hit rates’ (i.e., the lowest rate of contraband recovered).” In 2015, whites searched without consent were found to be carrying contraband at nearly two times the rate as blacks who were searched without consent.
“Officers expect and demand compliance even when they lack legal authority,”
5. The Department of Justice’s investigation into the behavior of police in Ferguson, Missouri, found “a pattern or practice of unlawful conduct within the Ferguson Police Department that violates the First, Fourth, and Fourteenth Amendments to the United States Constitution, and federal statutory law.” The scathing report found that the department was targeting black residents and treating them as revenue streams for the city by striving to continually increase the money brought in through fees and fines. “Officers expect and demand compliance even when they lack legal authority,” the report’s authors wrote. “They are inclined to interpret the exercise of free-speech rights as unlawful disobedience, innocent movements as physical threats, indications of mental or physical illness as belligerence.”
“African Americans are more than twice as likely as white drivers to be searched during vehicle stops even after controlling for non-race based variables such as the reason the vehicle stop was initiated, but are found in possession of contraband 26% less often than white drivers, suggesting officers are impermissibly considering race as a factor when determining whether to search,” the authors wrote. Nearly 90 percent of documented uses of force by the Ferguson Police Department were used on African-Americans, and every documented use of a police canine bite involved African-Americans.
6. In Chicago, a 2016 Police Accountability Task Force report found that “black and Hispanic drivers were searched approximately four times as often as white drivers, yet [the Chicago Police Department’s] own data show that contraband was found on white drivers twice as often as black and Hispanic drivers.” The police department’s own data, the report found, “gives validity to the widely held belief the police have no regard for the sanctity of life when it comes to people of color.”
7. A 2014 analysis of Illinois Department of Transportation data by the American Civil Liberties Union found the following: “African American and Latino drivers are nearly twice as likely as white drivers to be asked during a routine traffic stop for ‘consent’ to have their car searched. Yet white motorists are 49% more likely than African American motorists to have contraband discovered during a consent search by law enforcement, and 56% more likely when compared to Latinos.”
8. A 2014 analysis by The New York Times found that in Greensboro, North Carolina, police officers “used their discretion to search black drivers or their cars more than twice as often as white motorists—even though they found drugs and weapons significantly more often when the driver was white.” That pattern held true for police departments in four states. In Greensboro, “officers were more likely to stop black drivers for no discernible reason. And they were more likely to use force if the driver was black, even when they did not encounter physical resistance.”
Between January 2004 and June 2012, the city conducted 4.4 million stops. Eighty-eight percent of those stops resulted in no further action, and 83 percent of the stopped population were black or Hispanic, despite the fact that those minority groups, together, made up just over half of the city’s overall population…
9. A 2013 ruling by a New York Federal District Court judge found that the New York Police Department’s “stop and frisk” practices violated the constitutional rights of minority citizens of the city. Between January 2004 and June 2012, the city conducted 4.4 million stops. Eighty-eight percent of those stops resulted in no further action, and 83 percent of the stopped population were black or Hispanic, despite the fact that those minority groups, together, made up just over half of the city’s overall population. (The number of stop-and-frisk stops has dropped dramatically since its peak in 2011.)
10. A 2011 investigation by the Justice Department found that the Maricopa County Sheriff’s Office, headed by Joe Arpaio, had “a pervasive culture of discriminatory bias against Latinos,” and that the office also tried to interfere with the department’s investigation. The sheriff’s office “engages in racial profiling of Latinos; unlawfully stops, detains, and arrests Latinos; and unlawfully retaliates against individuals who complain about or criticize [the office’s] policies or practices,” the report’s authors said. (Arpaio responded by saying, “We are proud of the work we have done to fight illegal immigration.”)
RACE AND THE USE OF NONLETHAL FORCE
11. A controversial working paper by Harvard professor Roland Fryer Jr. found that police officers are more likely to use their hands, push a suspect into a wall, use handcuffs, draw weapons, push a suspect onto the ground, point their weapon, and use pepper spray or a baton when interacting with blacks. The study found no evidence of racial bias when it comes to police shootings, but Fryer’s methodology has come under criticism. The study relied on police reports, which have been previously shown to be a flawed data set, and its finding on justified shootings focused largely on data from Houston, Texas. (Fryer defended his work, but admitted his research is far from perfect.)
12. A study by the Center for Policing Equity found, as characterized by a preview in The New York Times, that “African-Americans are far more likely than whites and other groups to be the victims of use of force by the police, even when racial disparities in crime are taken into account.” The study looked at 19,000 use-of-force incidents between the years 2010 and 2015.
13. A 2016 study by a team of professors from U.C.L.A., Harvard, Portland State University, and Boston University analyzed suspects’ booking photographs for phenotypical signs of whiteness to test the following hypothesis: “the Whiter one appears, the more the suspect will be protected from police force.” Their findings: “police used less force with highly stereotypical Whites, and this protective effect was stronger than the effect for non-Whites.”
14. At least one study found that Latino populations suffer from similar effects. A Department of Justice investigation into the Seattle Police Department found that more than 50 percent of cases “determined to be unnecessary or excessive uses of force” involved minorities. “Analysis of limited data suggests that, in certain precincts, S.P.D. officers may stop a disproportionate number of people of color where no offense or other police incident occurred,” the report said, though it stopped short of determining that the department was engaging “in a pattern or practice of discriminatory policing.” (The investigation found that, regardless of the race of the suspect or victim, police using force were doing so unconstitutionally nearly 20 percent of the time.)
WHEN OFF-DUTY OFFICERS ARE KILLED BY POLICE
15. A 2010 governor’s task force examining police-on-police shootings found even black and Latino police officers face a greater risk of being killed by police. In cases of mistaken identity, 9 out of the 10 off-duty officers killed by other officers in the United States since 1982 were black or Latino. “Inherent or [subconscious] racial bias plays a role in ‘shoot/don’t-shoot’ decisions made by officers of all races and ethnicities,” the report found.
FINDINGS ON THE USE OF HANDCUFFS
16. A Stanford study of police practices in Oakland, California, found that officers were disproportionally handcuffing blacks. “Regardless of the area of the city, disproportionate treatment by race was similar and the raw totals were stunning,” according to a Washington Post summary of the findings. The Post continues: “2,890 African Americans handcuffed but not arrested in a 13-month period, while only 193 whites were cuffed. When Oakland officers pulled over a vehicle but didn’t arrest anyone, 72 white people were handcuffed, while 1,466 African Americans were restrained.” The researchers also found significant differences in the way officers spoke to African Americans: “Using only the words an officer uses during a traffic stop, we can predict whether that [officer] is talking to a black person or a white person” with 66 percent accuracy.
STUDIES THAT FOUND LITTLE OR NO EVIDENCE OF ANTI-BLACK BIAS
17. There are some studies that draw other conclusions. Research by a Washington State University professor found that, while shown video simulations, officers were less likely to shoot unarmed black suspects than unarmed white suspects. They also took an extra 0.23 seconds, on average, before firing on black suspects in the simulations. “We found that officers were slightly more than three times less likely to shoot unarmed black suspects than unarmed white suspects,” the researchers noted, while allowing for the possibility that the officers might act differently in live situations, and that the officers may have adjusted their behavior because they were being tested.
18. In a 2007 study, University of Chicago researchers used simulations to compare the abilities of police officers and the general population to determine whether to shoot a target that was flashed before them. The targets featured a mix of armed and unarmed black and white people. While “both samples exhibited robust racial bias in response speed,” researchers concluded that “officers outperformed community members on a number of measures, including overall speed and accuracy.” The bias related to response speed was found to be anti-black.
Kia Makarechi is VanityFair.com’s story editor and associate director of audience development. He lives in New York.
Founder’s Note: I dont think that too many people are surprised by this information, it confirms what I already understand to be true and that I’ve experienced.
Become a Harlem Insider!
By submitting this form, you are consenting to receive marketing emails from: Harlem World Magazine, 2521 1/2 west 42nd street, Los Angeles, CA, 90008, https://www.harlemworldmagazine.com. You can revoke your consent to receive emails at any time by using the SafeUnsubscribe® link, found at the bottom of every email. Emails are serviced by Constant Contact


